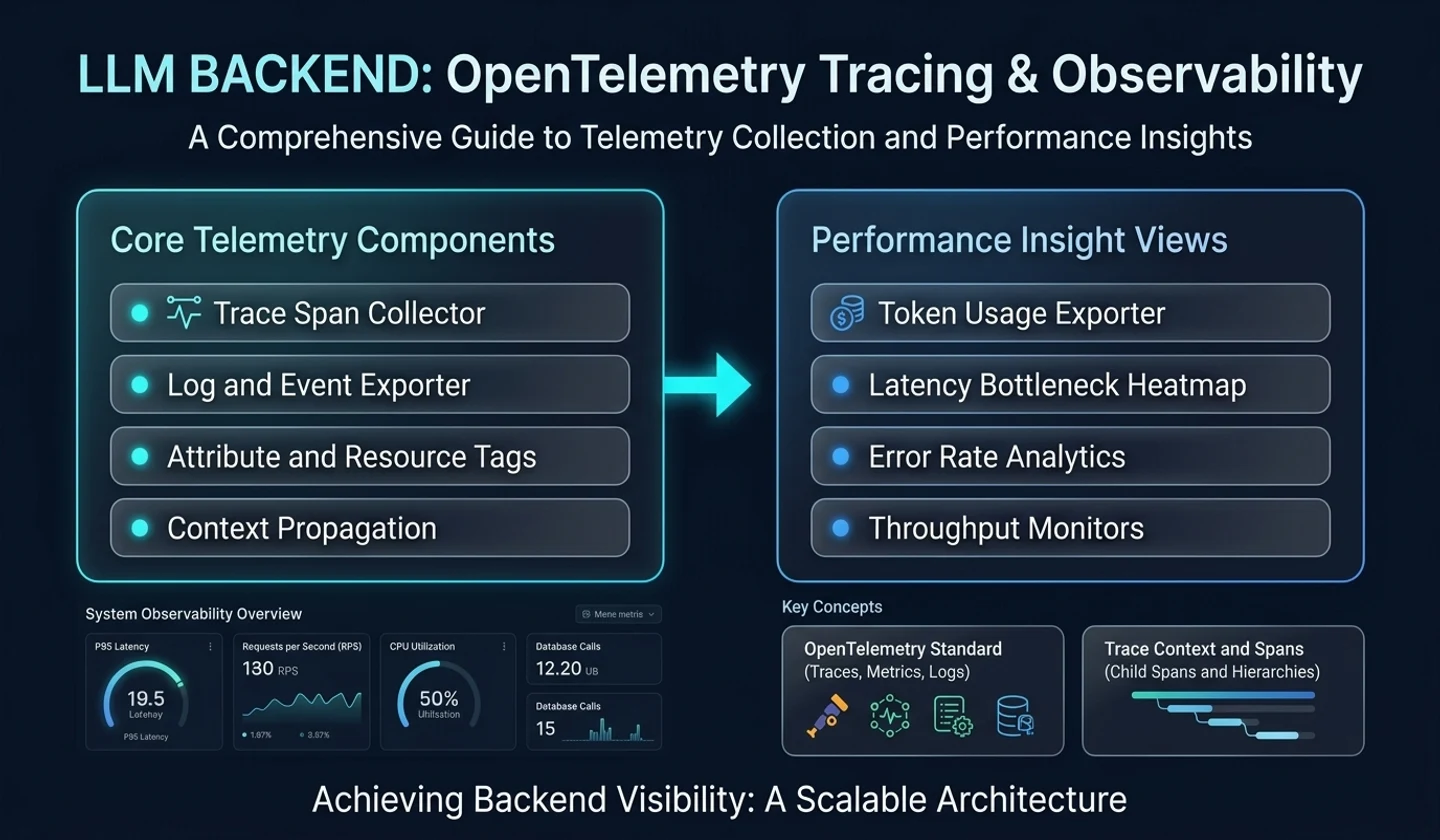
View API, RAG, model call, and response validation as one flow
In this article, we outline how to connect the request flow of the LLM service with a trace using OpenTelemetry.
Failure analysis for LLM services is more difficult than for regular APIs. This is because search, model call, response validation, storage, cache, and external provider call are mixed within one request. Users say “response is slow,” but the actual cause may be vector search, model call, or schema validation retry.
So we need a trace.
Analysis base date: 2026-05-12 Practice standard environment: FastAPI, OpenTelemetry, PostgreSQL, Redis, LLM Provider API Main reference materials: OpenTelemetry Docs, W3C Trace Context, Google SRE
Key takeaways
- OpenTelemetry is an observability framework for creating, collecting, and exporting traces, metrics, and logs.
- LLM requests must be divided into API, retrieval, LLM call, validation, and DB save into spans.
- trace_id must be connected to log, metric, and eval result.
- The original text of the prompt and the full text of the document are not included in the span attribute.
- You should look at p95/p99 latency, error rate, and token usage along with trace.
1. Why trace is needed for LLM services
The LLM request is divided into several subtasks.
# This is an example.POST /answers→ authenticate→ rate limit check→ retrieval→ prompt build→ llm call→ schema validation→ db save→ responseIf your overall response time is 8 seconds, you can't improve it if you don't know where the time was taken.
| bottleneck location | possible cause |
|---|---|
| retrieval | vector index, metadata filter, DB load |
| prompt build | Excessive context, token calculation |
| llm call | provider delay, rate limit, output length |
| validation | schema failed, retry |
| db save | connection pool, transaction delay |
Trace shows this flow divided into spans.
2. OpenTelemetry basic concepts
| concept | explanation |
|---|---|
| Trace | One request entire flow |
| Span | Individual units of work within a trace |
| Attribute | key-value metadata attached to span |
| Metric | Numerical data over time |
| Log | Individual event recording |
| Collector | Telemetry collection, processing, and transmission components |
In LLM services, it is important to connect trace and token usage metrics.
3. LLM request span design
Recommended span structure:
# This is an example.answer.create├── auth.check├── rate_limit.check├── retrieval.search│ └── vector.query├── prompt.build├── llm.call├── output.validate└── answer.saveThe duration and error status are recorded for each span.
4. trace ID propagation
If there is atraceparentheader coming from outside, it is inherited, and if not, a new trace is created.
# This is an example.traceparent: 00-0af7651916cd43dd8448eb211c80319c-b7ad6b7169203331-01Including a request_id or trace_id in the response also makes tracking easier when receiving a crash report.
// This is an example JSON structure.{ "answer": "...", "trace_id": "0af7651916cd43dd8448eb211c80319c"}5. Span Attribute Design
A good attribute should be helpful for analysis and not contain sensitive information.
| Attribute | example | caution |
|---|---|---|
llm.provider | openai | OK |
llm.model | configured-model | OK |
llm.prompt_version | answer.v3 | OK |
llm.input_tokens | 3200 | OK |
llm.output_tokens | 800 | OK |
rag.top_k | 5 | OK |
rag.document_scope | official_docs | OK |
user.question | original question | Don't put it in |
prompt.full | full prompt | Don't put it in |
document.content | chunk specialty | Don't put it in |
6. Sensitive information and security
Security Caution OpenTelemetry attributes and logs should not include the original text of the prompt, full text of the document, personal information, API key, or access token. Since observable data can also be transmitted to external systems, its security level must be managed separately.
Instead, record hash, length, and category.
# This is an example.question_hashprompt_versioncontext_token_countretrieved_chunk_countdocument_scope7. Connect Metrics and Logs
It is difficult to see the overall trend using Trace alone. Metrics and logs must also be designed together.
| Signal | role |
|---|---|
| Trace | Detailed flow of one request |
| Metric | All trends and notifications |
| Log | Events and debugging information |
Example metric:
# This is an example.llm_request_duration_msllm_provider_latency_msllm_schema_validation_fail_totalrag_retrieval_latency_msrag_empty_result_totalllm_input_tokens_totalllm_output_tokens_totalLogs must include trace_id.
// This is an example JSON structure.{ "level": "ERROR", "message": "LLM schema validation failed", "trace_id": "0af...", "prompt_version": "answer.v3", "error_code": "SCHEMA_VALIDATION_FAILED"}8. What to see in Dashboard
Your initial dashboard doesn't have to be complicated.
# This is an example.[ ] Number of requests[ ] p50/p95/p99 latency[ ] error rate[ ] provider latency[ ] schema validation failure rate[ ] retrieval latency[ ] token usage[ ] cache hit rate[ ] eval pass rateGoogle SRE's four golden signals - latency, traffic, errors, and saturation - can be expanded to suit the LLM service.
9. FastAPI example structure
# This is example code.from opentelemetry import trace tracer = trace.get_tracer(__name__) # This declaration shows an example flow.async def create_answer(req): with tracer.start_as_current_span("answer.create") as span: span.set_attribute("llm.prompt_version", "answer.v3") with tracer.start_as_current_span("retrieval.search") as s: chunks = await retrieve(req.question) s.set_attribute("rag.top_k", len(chunks)) with tracer.start_as_current_span("llm.call") as s: result = await call_llm(req, chunks) s.set_attribute("llm.input_tokens", result.usage.input_tokens) s.set_attribute("llm.output_tokens", result.usage.output_tokens) with tracer.start_as_current_span("output.validate"): validated = validate_output(result) return validatedThis example is code to demonstrate the structure. In the actual service, middleware, exporter, and collector settings are required.
10. Practical checklist
# This is an example.[ ] Can I view the entire request as one trace?[ ] Are retrieval, llm call, and validation separate spans?[ ] Is trace_id included in API responses and logs?[ ] Is there no sensitive information in the span attribute?[ ] Is token usage recorded as a metric?[ ] Do you track schema validation failure?[ ] Do you see p95/p99 latency in the dashboard?[ ] Is it possible to connect eval result and prompt_version?Failure case: There are a lot of logs, but the bottleneck cannot be found.
Even though the LLM service leaves many logs such asrequest started,retrieval done, andmodel done, it is sometimes difficult to analyze the failure. Although we know that each log belongs to the same request, it is difficult to see at a glance which step is pushing up the p95 latency, how many retries occurred, and whether the validation failure occurred before or after the model call. A log is a list of events, and a trace shows the parent-child relationship and time between events.
In particular, RAG requests are a bottleneck that changes every time. Some requests have slow vector search, some have long provider queues, and some require a second model call due to schema validation retry. If there are spansapi.request,retrieval.search,llm.call,output.validate, andanswer.persistin one trace, the problem location can be separated step by step.
Example implementation: LLM request span structure
trace llm_answer_requestspan api.requestspan auth.checkspan retrieval.searchspan llm.callspan output.validatespan answer.persistEach span attribute contains an operable summary value rather than the original text.
llm.model = "runtime-selected-model"llm.prompt_version = "rag_answer.v4"llm.input_tokens = 4200llm.output_tokens = 620retrieval.top_k = 8retrieval.index = "document_chunks_hnsw_v2"validation.schema = "answer_with_citations.v2"It is important not to include the full text of the prompt, the full text of the document, or user personal information in the attribute. Instead, it leaves the minimum values necessary for reproduction and analysis, such as hash, token count, version, and chunk id.
Checklist application results
| Check items | good signal | danger signal |
|---|---|---|
| trace connection | API, retrieval, LLM, validation span in one trace | Only step-by-step logs are scattered |
| Sensitive information | Save only the prompt hash and token count | Save the original prompt and chunk text |
| cost analysis | Token usage is linked to trace and metrics | Separate cost report and fault trace |
| retry | The retry span appears to be a child of the original call. | Retry looks like a new request |
With this structure, a vague report of “LLM is slow” can be changed to “retrieval p95 has increased” or “schema validation retry has increased”.
Operational example: Narrowing down slow response reports to traces
Let's say a user reports that "it took 12 seconds to reply." If there is no trace, you will have to search through the logs chronologically. If you have a trace, you can immediately compare which spans spent time within one request.
| Span | Normal range example | report trace | analysis |
|---|---|---|---|
| auth.check | 20ms | 18ms | normal |
| retrieval.search | 300ms | 4,800ms | Search bottleneck |
| prompt.build | 80ms | 120ms | normal |
| llm.call | 2,500ms | 2,900ms | slightly increased |
| output.validate | 50ms | 1,700ms | retry doubt |
In this trace, you can't just blame the provider. Both retrieval and validation are slow. Next checks are vector index status, metadata filter selectivity, and validation failure log. You should also check the metric to see ifrag_empty_result_totalorschema_validation_fail_totalhas increased during the same time period.
A borderline case is the masking of sensitive information. To quickly see the failure, put the prompt and chunk text into the span attribute, and later the observable storage becomes a private information storage. Instead, it is safer to leaveprompt_hash,chunk_ids,token_count, andschema_version, and handle reproductions that require the original text in a separate eval repository with permission. A good trace is less of an exhaustive log and more of a map that narrows down the cause.
11. Q&A
Q1. If I just leave a good log, is there no need to have a trace?
For small services, you can start with logs. However, if the request is broken down into multiple steps, trace is much more advantageous. In particular, a span is needed to distinguish between the LLM provider call and the retrieval bottleneck.
Q2. Wouldn't it be expensive to trace every request?
Sampling is available. However, it is recommended to preferentially preserve error requests, long-delay requests, and eval failure requests.
Q3. Can I put the contents of the prompt in the trace?
Not recommended. Prompts and document chunks may contain sensitive information. Replace with hash, token count, version, etc.
12. References and uncertainty
References
- OpenTelemetry Docs:https://opentelemetry.io/docs/
- What is OpenTelemetry:https://opentelemetry.io/docs/what-is-opentelemetry/
- W3C Trace Context:https://www.w3.org/TR/trace-context/
- Google SRE — Monitoring Distributed Systems:https://sre.google/sre-book/monitoring-distributed-systems/
uncertainty
- OpenTelemetry SDK settings vary depending on the language and framework.
- Sampling policies and data retention periods should be determined based on the organization's cost and security policies.
댓글
GitHub 계정으로 로그인하면 댓글을 남길 수 있습니다. 댓글은 GitHub Discussions를 통해 운영됩니다.